Etiket arşivi: economy

Almanya Güncel Enerji Görünümü

2019 Yılı

d0psqmwwwaazgnm
Ocak 2019’da Almanya’da kurulan yenilenebilir enerji santrallerinin toplam kurulu gücü:
1.6 MW Biyokütle
92.3 MW Rüzgar Onshore
579 MW Güneş
d0mlwluwsaamw_6
Almanya’da Şubat ayında yeni güneş rekoru!
Şubat 2019’da güneş enerjisi enerjisinin elektrik üretimindeki payı% 5,4’tür. Bu Şubat için yeni bir rekor.
Şubat 2018’de, pay% 4.3 idi.
d0r9ys6xcaasfqd
2019 yılı 8.hafta boyunca Almanya net elektrik üretimi: 4.15 TWh Yenilenebilir enerji – 6.79 TWh konvansiyonel enerji, yenilenebilir enerjinin payı %38.0
dzuag8tx0aempcs
2019 yılı 7.hafta boyunca Almanya net elektrik üretimi: 4.70 TWh Yenilenebilir enerji – 6.71 TWh konvansiyonel enerji, yenilenebilir enerjinin payı %41.2


dzzfbo0wkaacakw
Bugün Almanya’da bu yıl ilk kez elektrik üretiminde 20 GW’dan fazla güneş enerjisi üretimi gerçekleşti. Güneşin yükselmesi artıyor ve günler uzuyor.
dzuc8-uwsauxysw
Ocak 2019’da EEG hesap bakiyesi 5,1 milyar Euro olarak gerçekleşti. Bu, Ocak 2018’deki rakamdan 670 milyon Euro daha fazla. EEG hesabı Ocak ayında hiç bu kadar dolu olmamıştı!
EEG, Alman Yenilenebilir Enerji Kaynakları Yasasıdır.
dzjnrf4wwaaen66
2019 yılı 6.hafta boyunca Almanya net elektrik üretimi:5.93 TWh Yenilenebilir enerji – 6.02 TWh konvansiyonel enerji, yenilenebilir enerjinin payı %49.6
dzevdkjxqaa4pdh
9 Şubat’ta Almanya elektriğinin %71’ini yenilenebilir enerjiden elde etti: 1.186 TWh Yenilenebilir enerji – 0.469 TWh konvansiyonel enerji, yenilenebilir enerjinin payı %71.6
dyq8qnixqae6v-a
Alman elektrik ihracatında yeni rekor!
Ocak 2019’da, Almanya 7,2 TWh elektrik ihracat fazlası elde etti. Bu, Ocak 2016’nın bir önceki rekor ayına göre% 13 daha fazla.
dyl-m6pxqamn1xx
2019 yılı 5.hafta boyunca Almanya net elektrik üretimi: 3.74 TWh Yenilenebilir enerji – 8.11 TWh konvansiyonel enerji, yenilenebilir enerjinin payı %31.6

Almanya Güncel Enerji Görünümü yazısının devamı

Malaysia Energy Profile: Strategically Located For Seaborne Energy Trade – Analysis

Malaysia’s energy industry is a critical sector of growth for the entire economy and has accounted for nearly 20% of the country’s total gross domestic product in recent years.1

cityscape-bombay

New tax and investment incentives, which started in 2010, promote oil and natural gas exploration and development in the country’s deepwater and marginal fields, energy efficiency measures, and use of alternative energy sources. These fiscal incentives are part of the country’s economic transformation program to leverage its resources and geographic location to become one of Asia’s top energy players by 2020.2

Another key pillar in Malaysia’s energy strategy is to become a regional oil and natural gas storage, trading, and development hub that will attract technical expertise and downstream services that can compete within Asia.

Malaysia, located within Southeast Asia, has two distinct parts. The western half contains the Peninsular Malaysia, and the eastern half includes the states of Sarawak and Sabah, which share the island of Borneo with Indonesia and Brunei. The country’s western coast runs along the Strait of Malacca, an important route for the seaborne trade that links the Indian and Pacific Oceans. Malaysia’s position in the South China Sea makes it a party to various disputes among neighboring countries over competing claims to the sea’s oil and natural gas resources. Although it has bilaterally resolved competing claims with Vietnam, Brunei, and Thailand, an area of the Celebes basin remains in dispute with Indonesia. Potential territorial disputes with China, Vietnam, and the Philippines could emerge as the country’s exploration initiatives move into the deepwater areas of the South China Sea.

Malaysia Energy Profile: Strategically Located For Seaborne Energy Trade – Analysis yazısının devamı

UNITED ARAB EMIRATES Energy Profile: Among World’s 10 Largest Oil Producers – Analysis

Since gaining independence from the United Kingdom and uniting in 1971, the United Arab Emirates (UAE)—a federation of the seven emirates of Abu Dhabi, Ajman, Al Fujairah, Dubai, Ras al Khaymah, Sharjah, and Umm al Qaywayn—has relied on its large oil and natural gas resources to support its economy. The UAE is currently the seventh-largest petroleum producer in the world, and hydrocarbon export revenues are projected to account for $65 billion in 2017, roughly 20% of all export revenue. The share of hydrocarbon export revenues, which amounted to $129 billion (35% of total export revenue), has fallen since 2013 according to the International Monetary Fund (IMF) as a result of the decline in oil prices.1 Nonetheless, UAE’s crude oil and other petroleum liquids production has grown over the same period.

In addition to the country’s large hydrocarbon economy, the UAE is becoming one of the world’s most important financial centers and a major trading center in the Middle East. Investments in nonenergy sectors, such as infrastructure and technology, continue to provide the UAE with long-term insurance against oil price declines and global economic stagnation. IMF data indicate the UAE’s real gross domestic product slowed from 4.7% growth in 2013 to 4.0% in 2015 as a result of persistently low oil prices. The IMF expects UAE’s economic growth to be largely limited to 3.5% over the medium term.2

United Arab Emirates - energy infrasctructure. Source: EIA
United Arab Emirates – energy infrasctructure. Source: EIA

A member of the Organization of the Petroleum Exporting Countries (OPEC) since 1967—when Abu Dhabi joined—the UAE is one of the most significant oil producers in the world. The likelihood of further major oil discoveries is low, but the UAE uses enhanced oil recovery (EOR) techniques to increase the extraction rates of the country’s mature oil fields.

Natural gas use in the UAE is rising. Although the country is a member of the Gas Exporting Countries Forum (GECF), domestic demand is likely to draw heavily from the UAE’s natural gas resources. Currently, the country both imports and exports liquefied natural gas (LNG) and shares international natural gas pipelines with Qatar and Oman. The UAE is also one of the world leaders in the use of natural gas in EOR techniques. With natural gas demand rising, the UAE plans to expand domestic natural gas production by applying EOR techniques to gas wells.

UNITED ARAB EMIRATES Energy Profile: Among World’s 10 Largest Oil Producers – Analysis yazısının devamı

Fosil yakıtların iktidarı sürecek, karbon emisyonları her yıl artacak – TENVA Enerji Panorama Dergisi

BP Enerji Görünümü 2016 ile ilgili makalem Türkiye Enerji Vakfı’nın Enerji Panorama Dergisi’nde yer aldı.

Screenshots_2016-03-14-14-06-52

Screenshots_2016-03-14-16-52-46

Screenshots_2016-03-14-16-53-15

Screenshots_2016-03-14-16-53-47


Not: Yazı Türkiye Enerji Vakfı Enerji Panorama dergisi Mart sayısında 66-69 sayfaları arasında…  Yazımı okumak için http://www.tenva.org/wp-content/uploads/2013/08/Enerji-Panorama-Mart2016-web.pdf  Emeği geçen Türkiye Enerji Vakfı ve Enerji Panoroma Dergisi ekibine çok teşekkür ederim.

http://www.tenva.org/enerji-panorama/ sitesinden diğer sayılara da ulaşabilirsiniz. 

————————————————————————–

2016 Outlook: United Kingdom Wind Energy Industry

2015 was a record year for wind energy generation in the U.K, according to National Grid. National Grid’s statistics show that 11 percent of the U.K.’s electricity was generated by onshore and offshore wind last year – up from 9.5 percent in 2014.

2016 Outlook: United Kingdom Wind Energy Industry yazısının devamı

BP Energy Outlook 2016

“We expect the mix of fuels to change quite significantly over the next 20 years, gas to grow quickly, also strong growth in renewables like solar and wind.”

1452077438851

The Energy Outlook considers a base case, which outlines the “most likely” path for energy demand based on assumptions about future changes in policy, technology and the economy. In the base case, world GDP more than doubles, but unprecedented gains in energy efficiency, mean that the energy required to fuel the higher level of activity grows by only around a third over the Outlook. Fossil fuels remain the dominant form of energy powering the global expansion: providing around 60% of the additional energy and accounting for almost 80% of total energy supplies in 2035. Renewables grow rapidly, almost quadrupling by 2035 and supplying a third of the growth in power generation.

BP Energy Outlook 2016

What is the Iran nuclear deal worth to oil prices? About $5-$15 a barrel

Last week, the big news was the US and its Western allies coming to an agreement with Iran over sanctions.

Following this news, analysts in the oil market immediately began to ask what an open Iran could mean for markets.

On Tuesday, the US Energy Information Administration chimed in with its answer: $5-$15 a barrel.

In its latest short-term energy outlook, the EIA said:

On April 2, Iran and the five permanent members of the United Nations Security Council plus Germany (P5+1) reached a framework agreement that could result in the lifting of oil related sanctions against Iran. Lifting sanctions could substantially change the [short-term energy outlook] forecast for oil supply, demand, and prices by allowing a significantly increased volume of Iranian barrels to enter the market. If and when sanctions are lifted, the baseline forecast for world crude oil prices in 2016 could be reduced $5-$15/barrel (bbl) from the level presented in this STEO.

In its latest report, the EIA sees West Texas Intermediate crude oil prices — the US benchmark — in 2016 at around $70 a barrel, with futures contracts currently indicating prices will fall closer to $60 a barrel.

Screen Shot 2015 04 07 at 2.33.04 PMEIA

The EIA added:

Iran is believed to hold at least 30 million barrels in storage, and EIA believes Iran has the technical capability to ramp up crude oil production by at least 700,000 bbl/day (bbl/d) by the end of 2016. The pace and magnitude at which those volumes would reach the market would depend on the terms of a final agreement.

Of course, what exactly the framework agreement with Iran will ultimately guarantee, either for Iran or the US and its allies, remains unclear.

But with oil prices about 50% lower than when they were a year ago, even the potential for Iran’s supply to further disrupt markets is something that bears close watching.

On Tuesday, WTI crude prices were up about 3% to around $53 a barrel.

Source: Businessinsider

2016 Outlook: Wind Energy Industry

Humanity’s future, to say nothing of its prosperity, will depend on how we tackle the two central energy challenges that face us: securing the reliable supply of affordable energy, and switching rapidly to efficient low-carbon energy. Energy is vital for everyone, therefore, the states manage energy resources, in order to the addiction and fight hard to use environmentally friendly energy sources. The biggest story is in the case of renewables, it is no longer a niche. Renewable energy has become a mainstream fuel and will have a major role. Renewable energy which has been created awarness by all over the world, especially wind energy industry has been strategically important position for all states of modern world in terms of economic and politic.

Screenshots_2016-02-10-14-59-47

Global renewable installed capacity reached an estimated 913.48 GW in 2015. China dominated a number of renewable energy markets last year and was a global leader in terms of annual capacity additions in solar, biomass, small hydropower and onshore wind. In the global wind energy market, while China is maintaining its place, America, Germany and India continued to be the most important actors. Also, Brazil was achieved the highest growth rates in all major markets. Africa, Asia and Latin America which will become the market leaders of the next decade. The annual global wind power industry reached an installed 63,013 MW in 2015, representing annual market growth of 22%. Although final numbers for 2015 aren’t in yet, several sources, including Bloomberg and FTI Consulting, speculate that number could reach as high as 60 GW. Thus, total global capacity reached 432,419 MW at the end of 2015, representing cumulative growth of 17%.

Screenshots_2016-02-10-15-00-57

2014 saw Asia overtake Europe as the region with the most installed wind power capacity. Much of that achievement was owed largely to China, which installed 23 GW of capacity in 2014. Early estimates indicate China may have installed 30,5 GW in 2015. Worldwide installed wind turbines meet 4% of world electricity demand. It also showed a 42% increase and had reached 371.334 MW in the 2014. Economic benefits, oil and natural gas supplying uncertainties, climate change and the urgent need for the use of environmentally friendly sourced technologies from air pollution are counted as reasons as to why the positive maneuvering in the wind energy sector.

aaeaaqaaaaaaaao-aaaajdzhndriytczltk5mjktngfhni05ntdiltbingexmgq3ywrkyq

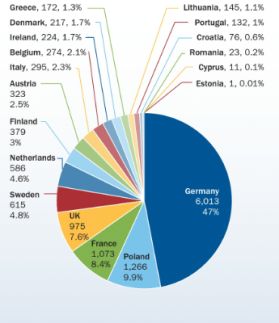
During 2015, 13,805.2 MW of wind power was installed across Europe, 5.4% more than in the previous year. 12,800.2 MW of it was in the European Union. Of the capacity installed in the EU, 9,765.7 MW was onshore and 3,034.5 MW offshore. In 2015, the annual onshore market decreased in the EU by 7.8 %, and offshore installations more than doubled compared to 2014. Overall, EU wind energy annual installations increased by 6.3% compared to 2014 installations. Germany was the largest market and Poland came second with 1,266.4 MW. There are now 16 European countries with more than 1,000 MW installed and 9 countries with more than 5,000 MW.

aaeaaqaaaaaaaapkaaaajgrhzdy1ytczltmzzmqtndg0yy04n2iyltaxytzkn2rkotdimw

2016 Outlook: Wind Energy Industry yazısının devamı

Rapor: 2015 yılı sonu Dünya Temiz Enerji Yatırımları

Bloomberg New Energy Finance (BNEF) kurumu, dünya temiz enerji yatırımlarını 2015 yılı sonu itibari ile görsel olarak özetledi. Rapora aşağıdan ulaşabilirsiniz.

Raporun PDF kopyası için tıklayınız .

2-ulkelere-gore-temiz-enerji-yatirimlari-2015

Rapor: 2015 yılı sonu Dünya Temiz Enerji Yatırımları yazısının devamı